Prometheus is an open-source systems monitoring and alerting toolkit. Prometheus collects and stores its metrics as time series data, i.e....
Prometheus is an open-source systems monitoring and alerting toolkit. Prometheus collects and stores its metrics as time series data, i.e. metrics information is stored with the timestamp at which it was recorded, alongside optional key-value pairs called labels. Grafana is an open-source platform for monitoring and observability. It allows you to query, visualize, alert on and understand your metrics no matter where they are stored.
We will use Helm to install and manage Prometheus and Grafana on AKS cluster.
Steps to be followed
- Install Prometheus and Grafana using Helm
- Setup Port-forwarding for both Prometheus and Grafana
- Create a Service Principal and add roles to AKS cluster RG
- Create Data Source in Grafana
- Import Azure Monitor for Containers in Grafana
- View the metrics in Grafana Dashboard
Install Prometheus and Grafana
# Define public Kubernetes chart repository in the Helm configuration
helm repo add prometeus-community https://prometheus-community.github.io/helm-charts# Update local repositories
helm repo update# Search for newly installed repositories
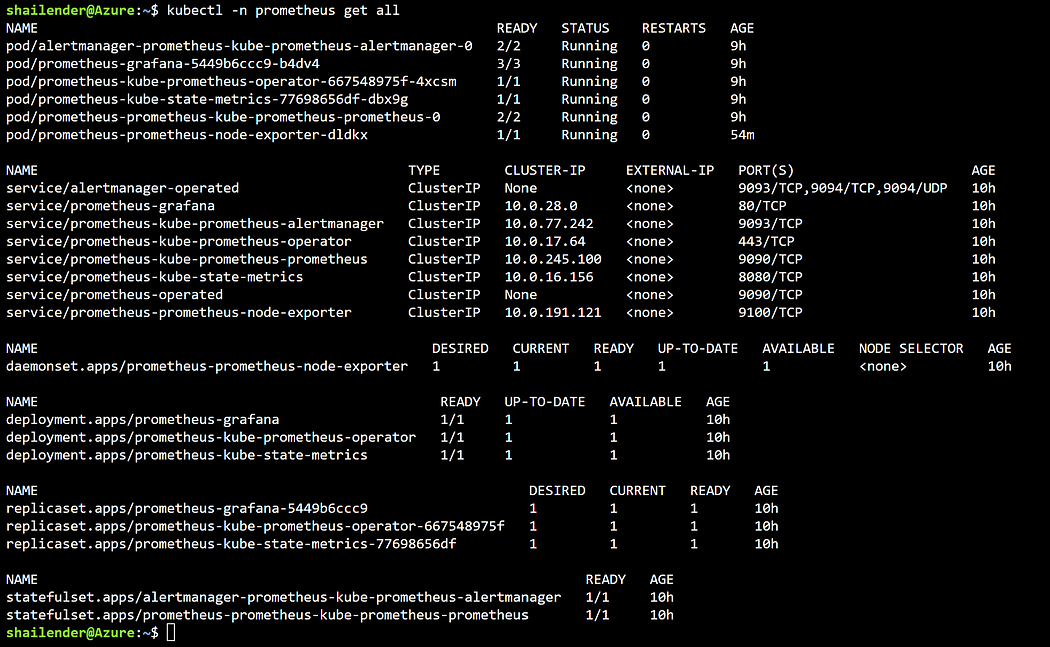
helm repo list# Install Prometheus using HELMhelm install prometheus prometeus-community/kube-prometheus-stack --namespace monitoring --create-namespace# Check all resources in Prometheus Namespacekubectl get all -n monitoring
Configure Prometheus and Grafana
# Port forward the Prometheus service
kubectl port-forward -n monitoring prometheus-prometheus-kube-prometheus-prometheus-0 9090
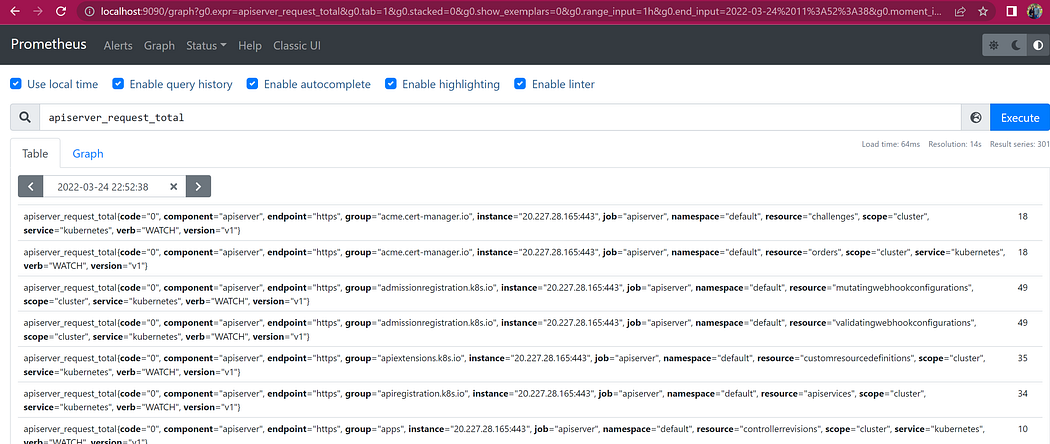
Open localhost:9090 in browser.
Prometheus uses Prometheus Query Language(PQL) to query Kubernetes metrics which is not easy to visualise. Search for API Server requests in Prometheus Dashboard.
In order to login to the Grafana dashboard, username and password are required which can be retrieved by using the below command:
# Port forward the Prometheus service
kubectl port-forward -n monitoring prometheus-prometheus-kube-prometheus-prometheus-0 9090# Get the Username
kubectl get secret -n monitoring prometheus-grafana -o=jsonpath='{.data.admin-user}' |base64 -d# Get the Password
kubectl get secret -n monitoring prometheus-grafana -o=jsonpath='{.data.admin-password}' |base64 -d# Port forward the Grafana service
kubectl port-forward -n monitoring prometheus-grafana-5449b6ccc9-b4dv4 3000
Open localhost:3000 in browser and login using the username and password.
Create a Service Principal and Assign Role
Create SPN and assign Monitoring Reader Role on the AKS Cluster ResourceGroup.
az ad sp create-for-rbac --role="Monitoring Reader" --scopes="/subscriptions/xxxxxx-xxxx-xxxx-xxxxx/resourceGroups/aksgrop"You will get the Output like this.

Save this output as we will use the app ID, tenant ID, and password later on.
Create a Log analytical workspace
Create Data Source in Grafana
Go to configuration and click Data Sources.
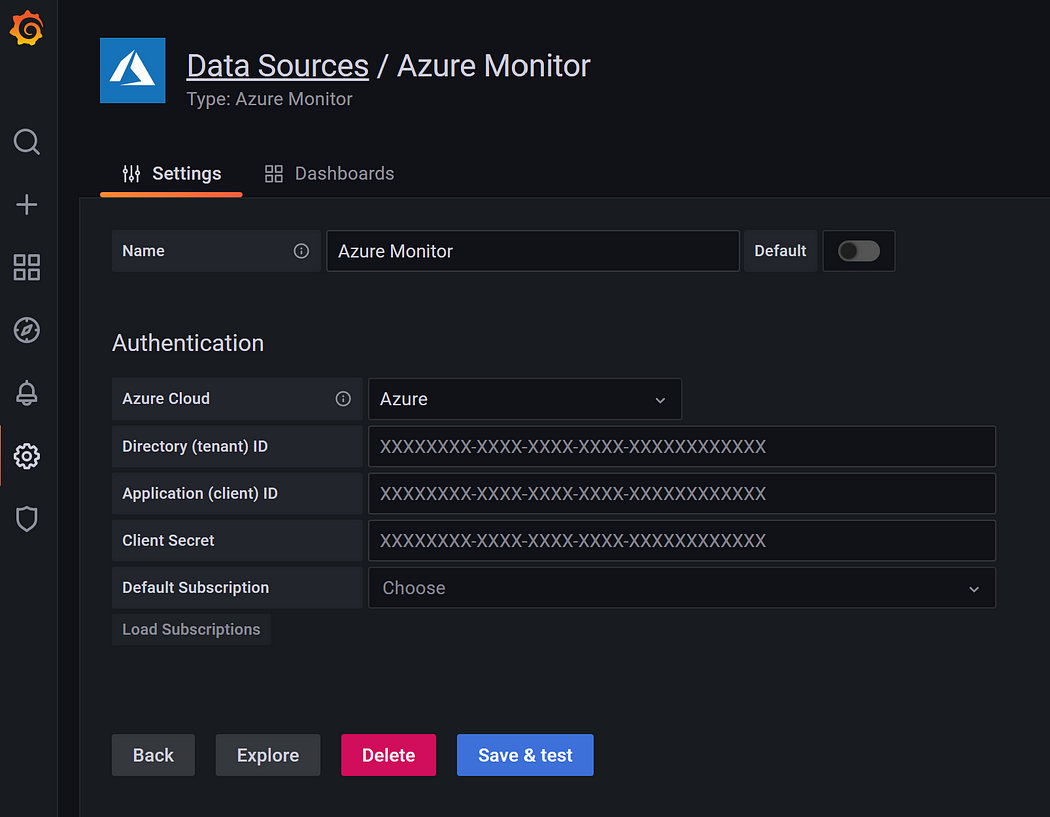
Click on Add Data Source and search for Azure Monitor.
Provide the required SPN values and save.
Import Azure Monitor for Containers in Grafana
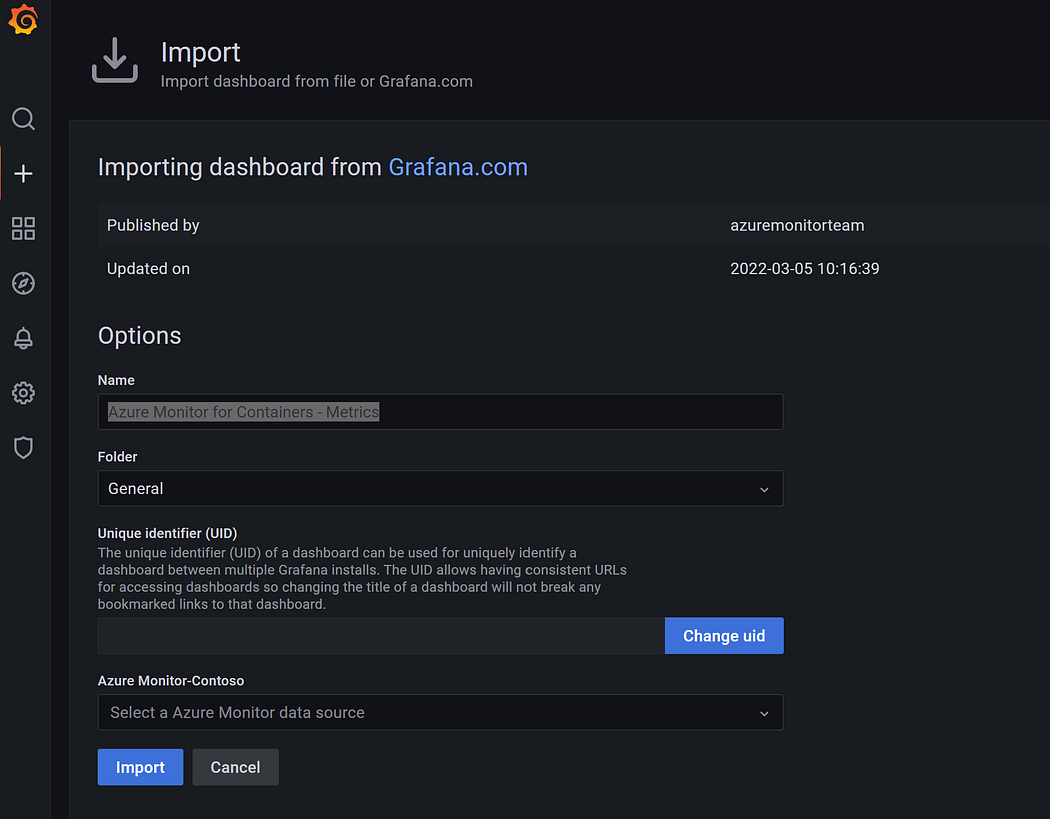
Go to Create and click import.
Import Dashboard ID 10956 and load and finally import the “Azure Monitor for Containers — Metrics” Dashboard.
View the metrics in Grafana Dashboard
Go to Dashboards and check multiple dashboards to get detailed mertics.
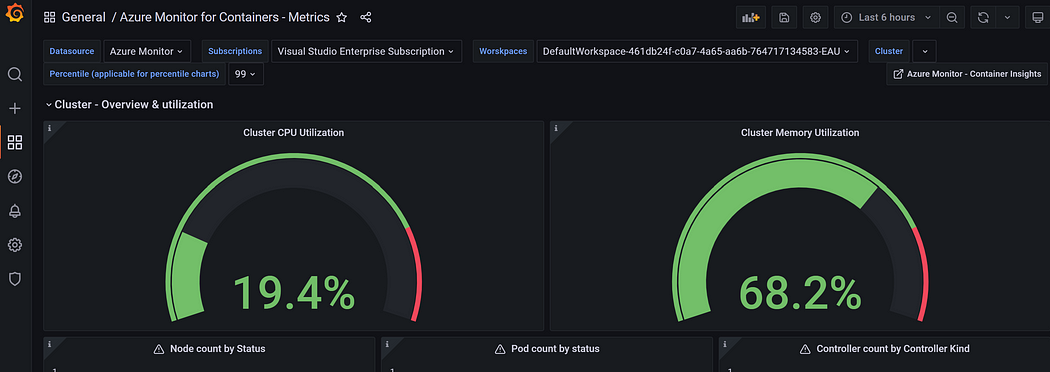
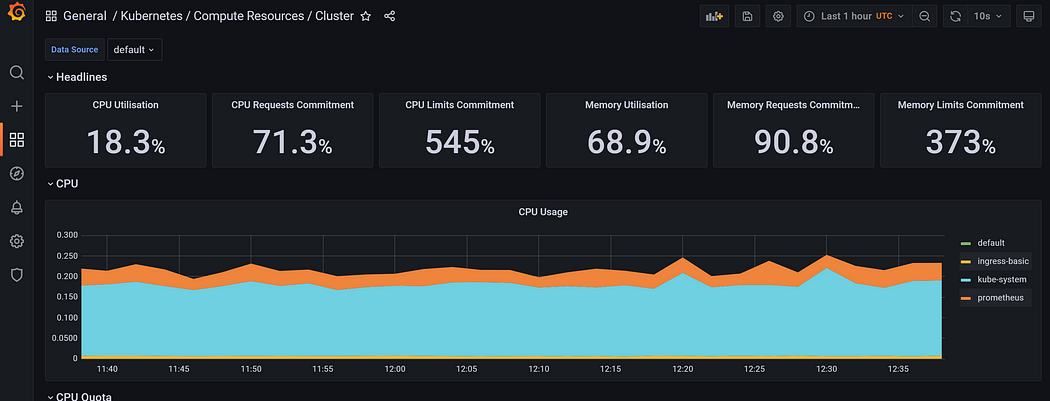
Dashboards give us a visual representation of the AKS cluster’s health, resource utilisation trends of specific application pods, network traffic flow across the cluster, and much more. Prometheus and Grafana are powerful monitoring tools for Kubernetes clusters, and Helm makes it simple to set up and get up and running in minutes.


COMMENTS